Analytical Migration Parameter Calibration for High Temperature Variable Simulant Matrices
Calibrating specific diffusion activation energies reduces high-temperature migration overestimations, securing defensible food-contact compliance dossiers.

Melt

Polymer Free Volume and Thermal Activation Mechanics
Thermal processing above the glass transition temperature unlocks macromolecular mobility in semicrystalline polyolefins, fluoropolymers, and high-temperature engineering resins. When food-contact materials operate above one hundred degrees Celsius, migrant transfer accelerates exponentially along Arrhenius relationships. The polymer expands locally, widening the micro-void channels that allow low-molecular-weight species to pass.
Additives like phenolic antioxidants, phosphite stabilizers, erucamide slip agents, and residual oligomers shift from trapped states into active flux.
Calibrating migration parameters at elevated temperatures requires measuring polymer chain relaxation directly. Standard European Union regulatory models intentionally overstate diffusion rates at room temperature to maintain safety margins, but high heat inverts this dynamic by altering the polymer matrix itself. For example, polypropylene contact layers subjected to retort sterilization at one hundred twenty-one degrees Celsius undergo structural shifts that change diffusional path lengths.
As crystallite boundaries soften under thermal stress, diffusion through amorphous regions speeds up.
At one hundred twenty-one degrees Celsius, polypropylene matrices exhibit diffusion coefficients two orders of magnitude higher than room-temperature extrapolations predict.

Simulant Interaction and Polymer Swelling Kinetics
Fatty food simulants cause severe plasticization when contacting polyolefins at high temperatures. Vegetable oils, ethanol mixtures, and synthetic triglycerides penetrate the polymer interface, lowering the effective glass transition temperature at the contact surface. This swelling expands molecular free volume and raises the local diffusion coefficient for embedded migrants.
Models that treat the polymer as an inert, non-swelling boundary fail once liquid simulants enter the matrix.
Alternative fatty food simulants, such as iso-octane and ninety-five percent ethanol, swell the matrix rapidly and disturb the kinetic equilibrium between polymer and liquid. Protocols using these solvents need precise correction factors to avoid overestimating migration or destroying the sample. As temperatures approach the melting point of lower-density fractions, physical dissolution and diffusional transfer start to overlap.
Calibration must isolate true diffusion from matrix erosion to get valid parameters.
High-molecular-weight hindered amine light stabilizers are often assumed to stay fixed within polyolefin matrices during high-temperature steam sterilization, though elevated heat can still drive measurable release.

Cell

Pressure Containment and Volatilization Control in Cell Architecture
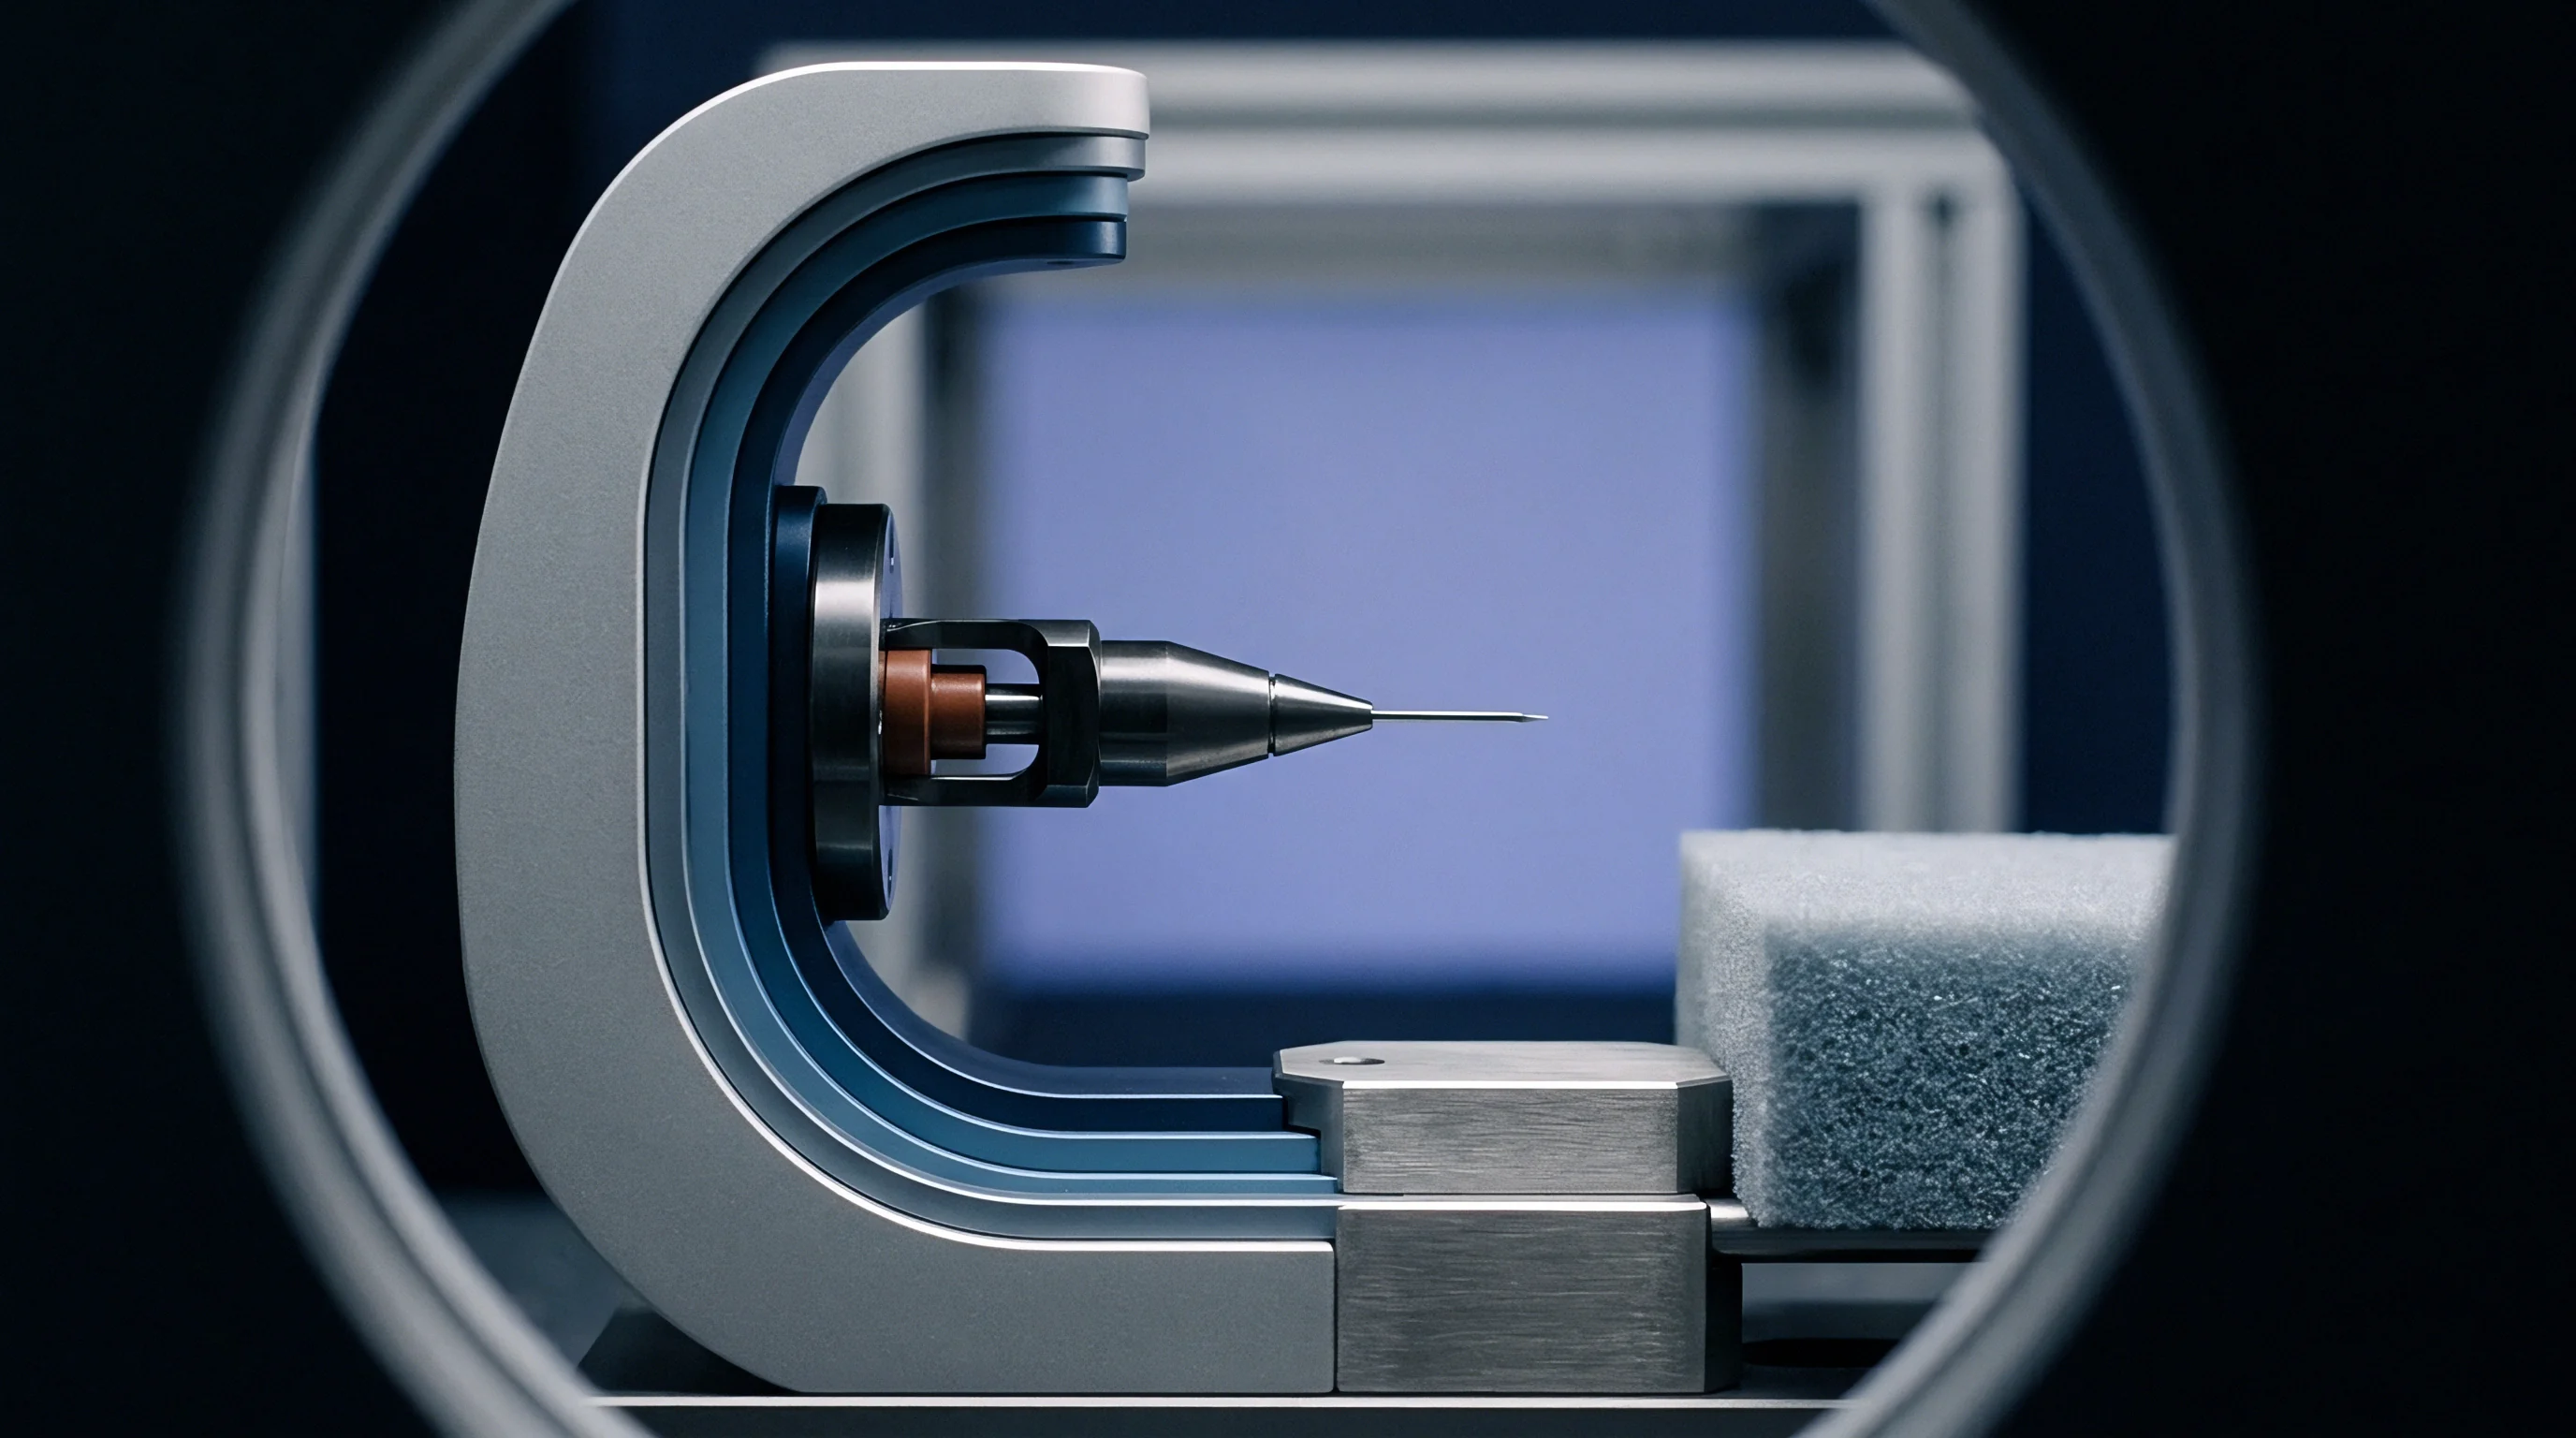
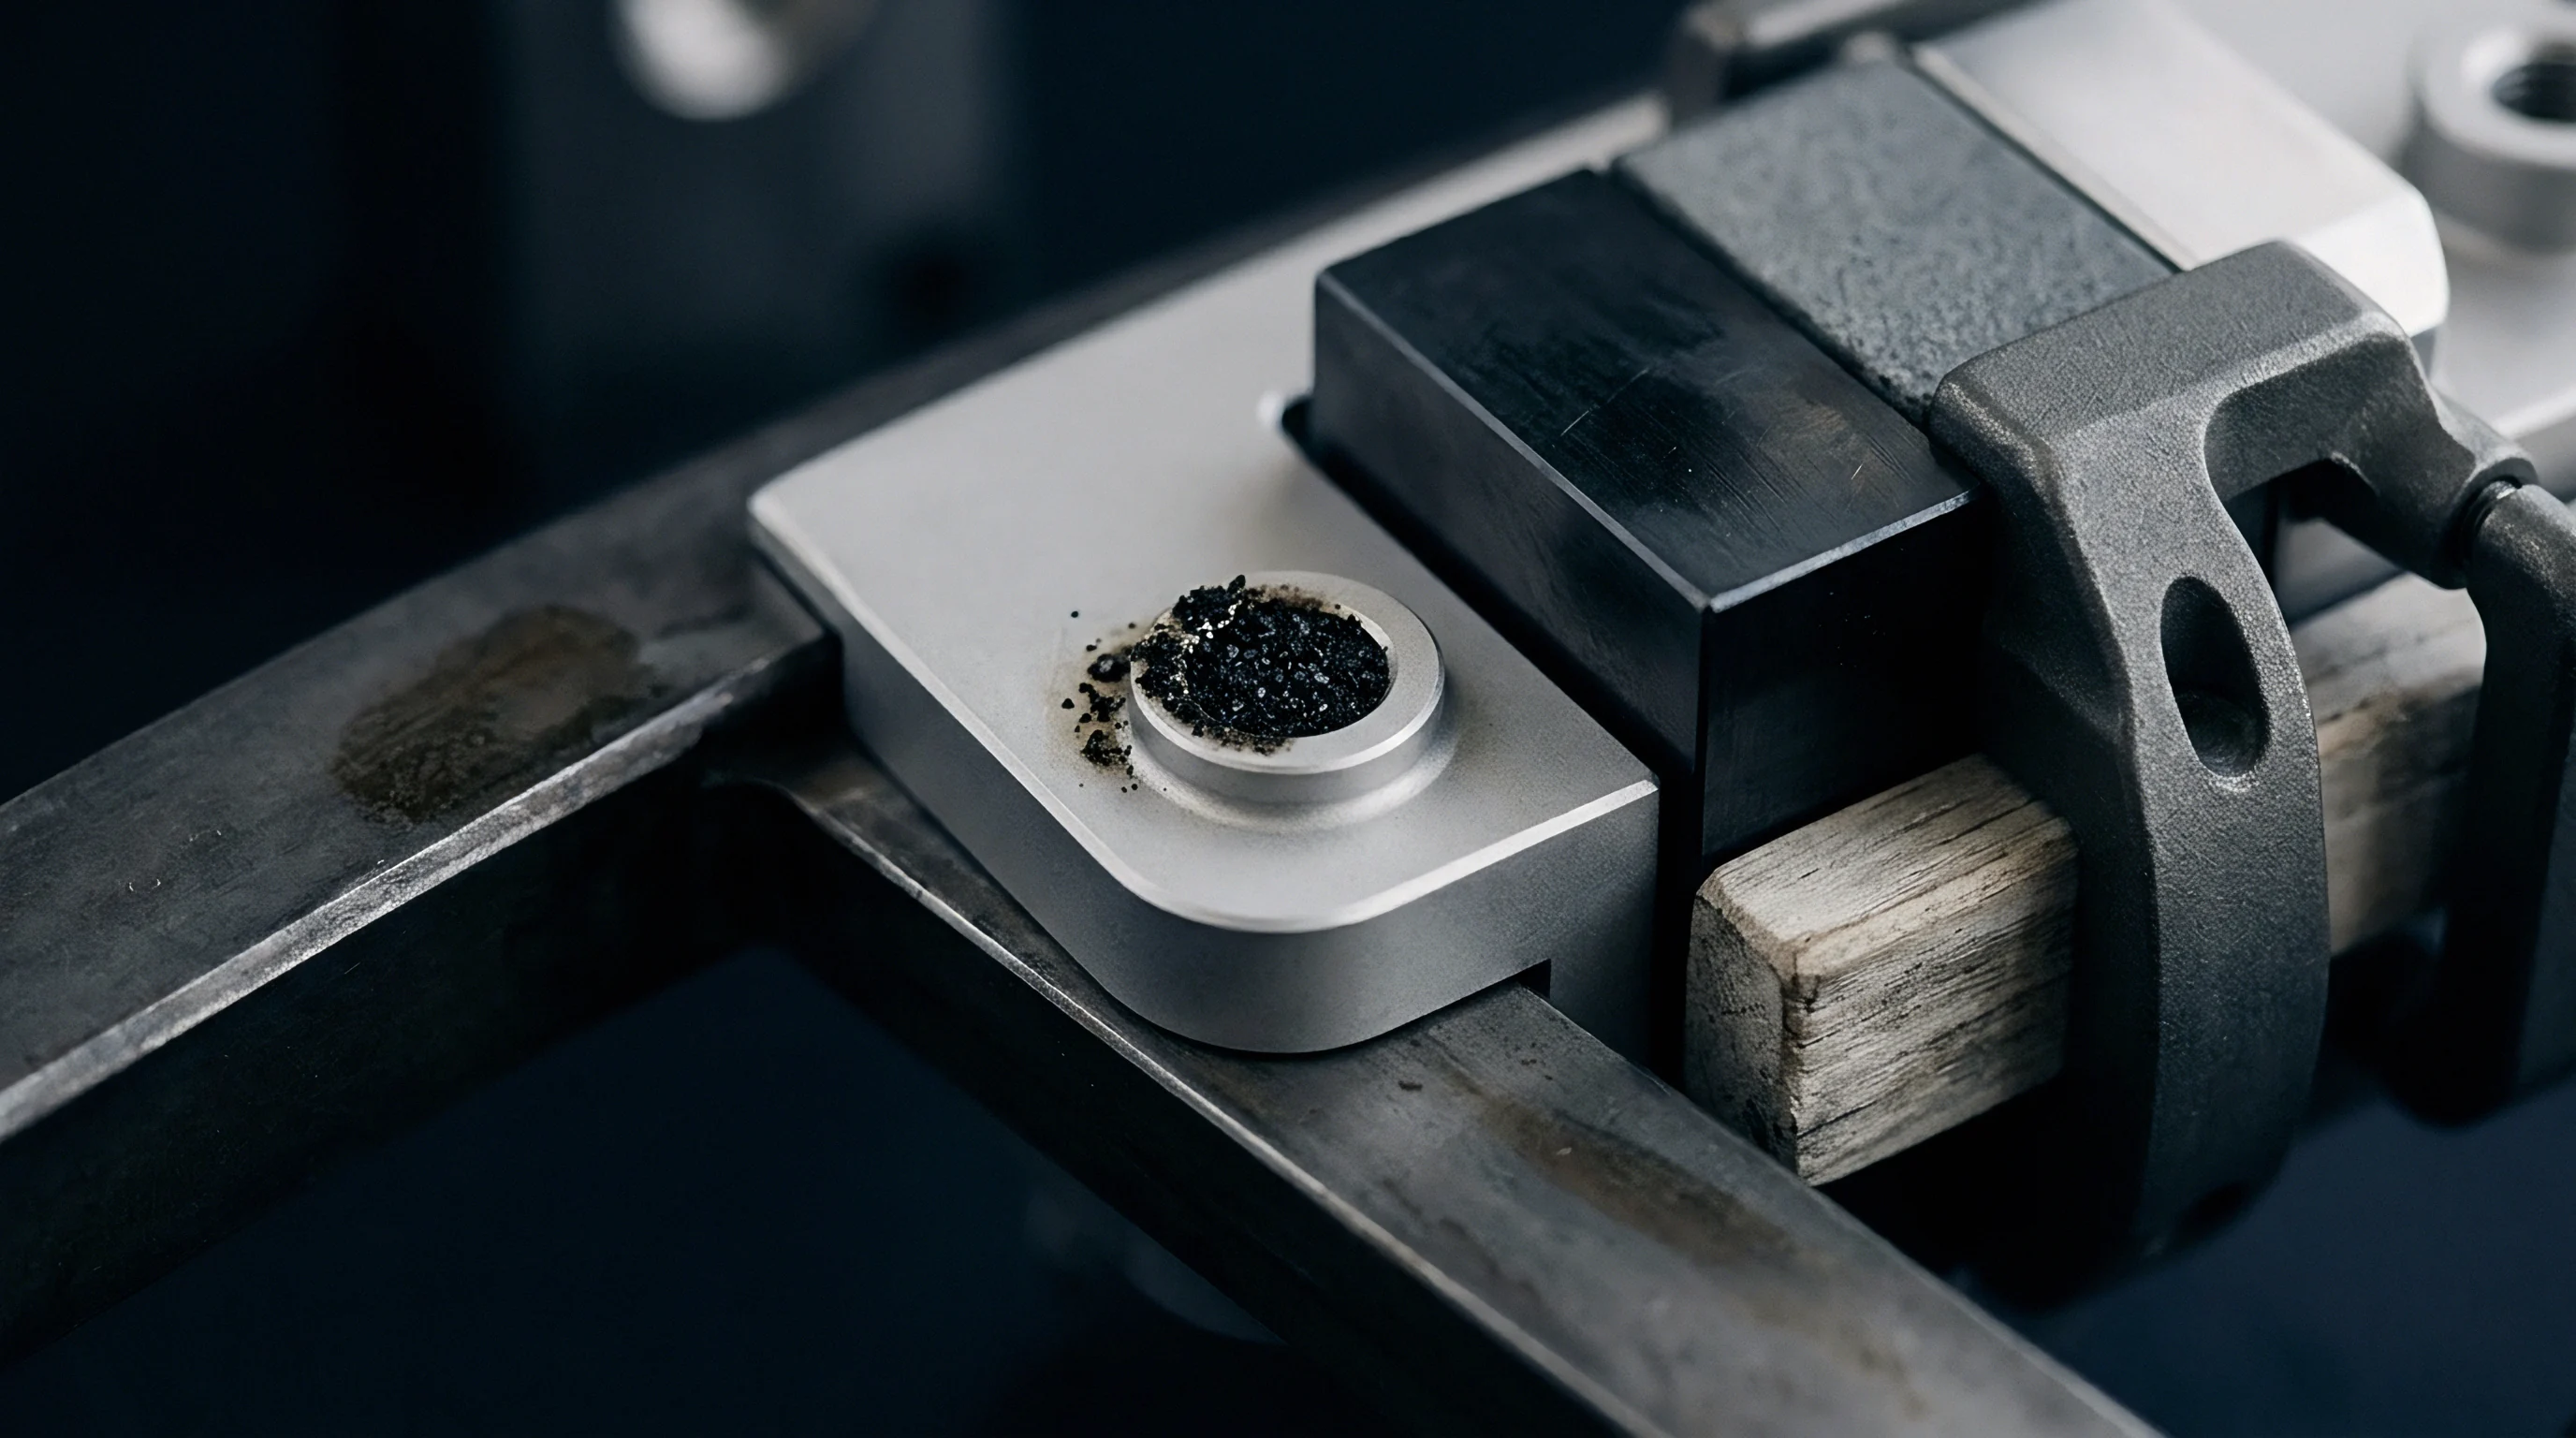
Testing migration at high temperatures requires sealed contact cells that hold structural integrity under vapor pressure. Standard open immersion testing under EN 1186 leads to lost simulant, altered surface-to-volume ratios, and total loss of volatile migrants. Stainless steel cells equipped with fluoropolymer gaskets and calibrated pressure-relief valves isolate the sample while preserving fluid volume.
At one hundred thirty degrees Celsius, sealing requires controlled torque to prevent fluid leaks or uneven specimen crushing.
Solid simulants like modified polyphenylene oxide, commercially known as Tenax, replace liquid fatty media for testing between one hundred and one hundred seventy-five degrees Celsius. Tenax works by gas-solid adsorption, trapping volatile and semi-volatile species that would vaporize from liquids at these temperatures. Calibrating with Tenax requires baseline corrections for particle size distribution and adsorption capacity at the target temperature.
Using too little adsorbent allows migrant breakthrough, undercounting mass transfer.
| Simulant Type | Standard Chemical Composition | Maximum Operating Temperature | Polyolefin Swelling Severity | Primary Failure Mode |
|---|---|---|---|---|
| Simulant A | 10 percent Ethanol in aqueous solution | 100 degrees Celsius | Negligible | Vapor expansion and cell seal rupture |
| Simulant B | 3 percent Acetic acid in aqueous solution | 100 degrees Celsius | Negligible | Corrosive pitting of metal cell walls |
| Simulant D2 | Refined Olive Oil or vegetable oil substitute | 175 degrees Celsius | Moderate to High | Thermal degradation of triglyceride matrix |
| Simulant E | Modified Polyphenylene Oxide (Tenax) | 175 degrees Celsius | None | Channeling and incomplete particle contact |
| Alternative D2 | 95 percent Ethanol or Iso-octane | 60 degrees Celsius | Severe | Excessive plasticization and polymer extraction |

Failure Modes in Variable Simulant Exposure
Cell failures during high-temperature runs ruin analytical validity and create misleading migration profiles. Distinguishing laboratory artifacts from actual chemical transfer requires checking how cells behave physically throughout the contact cycle.
- Simulant degradation artifacts occur when vegetable oils oxidize at high temperatures, creating fatty acid breakdown products that overlap with migrant chromatographic peaks.
- Specimen warping and edge exposure happens when unconstrained polymer plaques twist inside cells, exposing raw edges and artificially expanding contact surface area.
- Volatile migrant loss occurs when low-boiling organophosphites or residual monomers escape into cell headspace before extraction.
- Porous adsorbent saturation occurs when an inadequate Tenax bed allows high-concentration migrants to pass without adsorbing.
Losing pressure control during high-temperature runs invalidates the surface-to-volume ratio, forcing full re-testing across the entire batch history.
Spectrum
Chromatography and Response Calibration across Migrant Classes
Quantifying migrants isolated from high-temperature simulants requires specific instrument setups. Gas chromatography-mass spectrometry targets volatile and semi-volatile compounds like residual solvents, breakdown products, and slip agents. High-performance liquid chromatography with UV or mass spectrometry detectors handles heavier additives like Irganox 1010 and Irgafos 168.
To correct for matrix suppression, calibration requires authentic standards prepared directly in the target simulant or matched extraction solvents.
Thermal desorption gas chromatography measures migrants adsorbed on Tenax directly, eliminating solvent extraction. Transfer efficiency depends on desorption tube temperature, carrier gas velocity, and trap refocusing conditions. Calibration curves must cover the range between the limit of quantification and the specific migration limit set by Regulation (EU) 10/2011.
If detector response turns non-linear at higher concentrations, quadratic regression maintains calibration accuracy.
Regulation (EU) 10/2011 establishes a default specific migration limit analytical tolerance band of ten percent for validated mass spectrometry methods.
Non-Intentionally Added Substance Screening Dynamics
High temperatures break down primary antioxidants and polymer backbones, creating complex mixtures of non-intentionally added substances. Screening relies on electron-ionization libraries and high-resolution mass measurements to identify unknowns. Oligomeric fractions co-eluting with target migrants often interfere with peak integration, so calibration protocols must use internal standards to adjust for signal drift during long analytical runs.
| Migrant Chemical Class | Representative Compound | Analytical Instrument | Linearity Range (mg/kg) | Quantification Limit (mg/kg) |
|---|---|---|---|---|
| Phenolic Antioxidant | Irganox 1010 | HPLC-UV / MS | 0.05 – 20.0 | 0.02 |
| Organophosphite Stabilizer | Irgafos 168 | GC-FID / MS | 0.10 – 50.0 | 0.05 |
| Fatty Acid Amide Slip Agent | Erucamide | GC-MS | 0.20 – 30.0 | 0.08 |
| Cyclic Polyolefin Oligomers | C12-C30 Oligomer fraction | GC-FID | 0.50 – 100.0 | 0.15 |
| Photoinitiator / Monomer | Benzophenone / BADGE | LC-MS/MS | 0.01 – 5.0 | 0.005 |
Calibrating detection limits with pure solvent standards underestimates analytical noise relative to actual simulant extracts collected after high-temperature contact.
Regression

Mathematical Derivation of Migration Parameters
Determining diffusion coefficients from test data requires solving Fick’s Second Law for the applicable boundary conditions. For single-sided contact with a finite simulant volume, migrant concentration follows solutions derived from Crank’s diffusion equations. Fitting time-series mass transfer data yields both the polymer diffusion coefficient and the partition coefficient between polymer and simulant.
Modeling software relies on conservative polymer-specific parameters, known as Piringer A-prime values, to estimate upper-bound diffusion coefficients. At elevated temperatures, these default parameters can overestimate diffusion rates by three orders of magnitude, causing false compliance failures. Deriving realistic activation energies requires fitting multi-temperature data to the Arrhenius equation.
Plotting the natural logarithm of the diffusion coefficient against reciprocal absolute temperature gives the activation energy for diffusion in that specific matrix.

Which Mathematical Parameters Override Conservative Default Estimations during Elevated Temperature Exposure?
Measuring polymer density, glass transition temperature, and exact migrant molecular weight allows these direct values to replace generic Piringer defaults. Refined calculations use polymer conductance values reflecting actual structural crystallinity instead of assuming worst-case amorphous structures.
- Calculate experimental diffusion coefficients at three elevated temperatures using time-dependent concentration data.
- Plot the natural logarithm of these diffusion coefficients against reciprocal temperature in Kelvin.
- Run a linear regression to find the slope, which equals activation energy divided by the universal gas constant.
- Derive the pre-exponential factor from the y-intercept of the fitted line.
- Plug the calibrated activation energy and pre-exponential factor into Fickian models to simulate actual high-temperature exposure.

Worked Example for Polypropylene Oligomer Calibration
Consider a semi-crystalline polypropylene container holding aqueous food at one hundred twenty-one degrees Celsius for two hours. The container has a surface area of six square decimeters, a wall thickness of one thousand micrometers, and contacts one kilogram of simulant. The migrant is a polyolefin oligomer fraction with a molecular weight of four hundred forty grams per mole.
Standard Piringer modeling assigns polypropylene a default parameter of eleven point five, predicting a diffusion coefficient of four point two times ten to the minus nine square centimeters per second at this temperature.
Experimental testing in sealed pressure cells measures concentrations over time: zero point eighteen milligrams per kilogram at thirty minutes, zero point twenty-six at sixty minutes, and zero point thirty-five at one hundred twenty minutes. Fitting these points to Fickian curves reveals an actual diffusion coefficient of six point eight times ten to the minus ten square centimeters per second at one hundred twenty-one degrees Celsius. That is roughly six times lower than the default prediction, keeping calculated migration safely below the legal specific migration limit.
Calibrating actual activation energy from multi-temperature experimental data reduces predicted high-temperature migration values by up to eighty percent compared to default Piringer estimates.
| Polymer Matrix Type | Test Temperature (Celsius) | Default Piringer Parameter | Predicted Diffusion Coefficient (cm2/s) | Calibrated Diffusion Coefficient (cm2/s) | Activation Energy (kJ/mol) |
|---|---|---|---|---|---|
| Polypropylene Homopolymer | 121 | 11.5 | 4.2 x 10^-9 | 6.8 x 10^-10 | 92.4 |
| High-Density Polyethylene | 100 | 13.0 | 1.5 x 10^-8 | 2.1 x 10^-9 | 84.1 |
| Polyethylene Terephthalate | 150 | 3.1 | 8.5 x 10^-12 | 1.2 x 10^-12 | 125.6 |
| Polyamide 6 | 130 | 2.0 | 3.1 x 10^-11 | 4.5 x 10^-12 | 110.2 |
Whether regulatory authorities will accept non-standard calibrated diffusion parameters without multi-laboratory validation studies remains an open technical debate in compliance working groups.
Paperwork
Chain of Declaration and Supporting Dossier Structure
A Declaration of Conformity relies on the technical evidence in its supporting dossier. Under Regulation (EC) 1935/2004 and Regulation (EU) 10/2011, declarations backed by lab reports that do not match actual intended use conditions fail regulatory scrutiny. Compliance assertions must trace back through resin suppliers, masterbatch compounders, converters, and ink manufacturers.
Each upstream supplier must provide substance identities, restriction limits, dual-use additive disclosures, and functional barrier data.
High-temperature applications require documentation showing that testing or modeling covered the full severity of real-world exposure. A declaration claiming compliance for hot fill based on ten-day testing at forty degrees Celsius is legally invalid. Supporting dossiers need exact sample descriptions, resin lot numbers, surface-to-volume calculations, detection limits, and raw chromatographic data from calibration runs.

Auditing the Conformity File against Actual Test Parameters
Auditing third-party compliance documentation requires comparing declared operating conditions against actual laboratory test protocols. The auditor must verify that the test simulants match the food types that contact the finished article.
- Temperature time profile alignment ensures lab contact durations and thermal limits meet or exceed the maximum specifications of the application.
- Simulant selection fidelity verifies that fatty food simulants or Tenax were used when contact with oils, hot dairy, or fatty foods is expected.
- Surface to volume ratio scaling confirms test calculations match the dimensions and volumes of the commercial package.
- Dual-use additive disclosure identifies substances approved as direct food additives to confirm total exposure remains within legal limits.
Standard supply agreements often include indemnity clauses that require suppliers to cover product recall costs if supporting dossiers fail regulatory audit during enforcement actions.
Margin

Financial Impact of Calibration Choice and Risk Buffers
Choosing calibrated migration parameters over default modeling affects both direct testing costs and commercial exposure. Physical lab testing for high-temperature fatty food contact using olive oil or Tenax runs over three thousand euros per sample and takes upwards of six weeks. Modeling with calibrated parameters cuts routine verification costs dramatically while remaining scientifically sound.
Relying solely on default models risks false-positive failures, which can force unnecessary resin reformulations or design changes that drive up resin costs per ton.
Commercial risks escalate rapidly if non-compliant packaging reaches the market. Border rejections, customs holds, and notifications under the Rapid Alert System for Food and Feed trigger immediate financial liabilities. Pulling a single production lot from distribution often costs over one hundred thousand euros, before legal fees and brand damage.
Operating on narrow margins derived from default models leaves packaging vulnerable if enforcement labs refine their testing procedures.
Accurately calibrating high-temperature migration parameters creates a defensible compliance baseline. This approach protects investments in high-temperature resins while producing documentation that stands up to regulatory audit.